A few weeks ago an alarm triggered on a production Kubernetes cluster I am working on. It warned of high CPU throttling and frequent restarts on the VPC CNI daemonset. We had just added a new network policy, so I expected a slight increase in CPU usage as this daemonset enforces these policies. What I didn't expect was 70% throttling. The weirdest part was Grafana showing the CPU as virtually idle.
There were no container errors. The node wasn't under pressure. The metrics looked valid. So why was there throttling?
CPU Limits and Throttling
Alexandru Lazarev has an explanation with an easy solution: remove CPU limits. It is a problem of averages. Grafana flattens CPU usage spikes because it averages over time. But throttling percentage is calculated only when the CPU is used. A container where the CPU is mostly idle but has occasional traffic spikes, has low average CPU usage. But if the CPU is throttled in each spike, the throttling percentage is high.
Kubernetes uses the Linux CFS to distribute CPU time between containers. By default, it works in 100ms periods. When a container has a CPU request set, it is guaranteed an amount of CPU time each period. If spare CPU time is available a container can request to use it, up to its CPU limit. A CPU limit caps the CPU time it can use each period. Once the cap is reached it is throttled until the next period even if there is spare CPU time. Because CPU can be redistributed each period, CPU limits will often lead to throttling. That's why setting CPU limits is not recommended by some Kubernetes contributors, and removing the CPU limit could resolve my issue.
You can view the CPU time period and the quota a container has directly in Prometheus using these queries:
container_spec_cpu_period{pod="pod-name"} #shows CFS period
container_spec_cpu_shares{pod="pod-name"} #shows CPU request
container_spec_cpu_quota{pod="pod-name"}  #shows CPU limit
Before making the change I wanted to verify the throttled container did have spiky traffic. This meant I had to dig into the CPU metrics.
What do the CPU metrics actually show?
The default Grafana dashboard for a pod appears simple. It shows CPU usage and CPU throttling. But understanding what these plots actually show is not obvious.
CPU Usage
CPU usage is calculated by the following PromQL query:
sum(node_namespace_pod_container:container_cpu_usage_seconds_total:sum_irate{namespace="$namespace", pod="$pod", cluster="$cluster"}) by (container)This is a sum of the Prometheus recording rule. Going to the /rules endpoint on Prometheus shows this rule to be generated by:
sum by(cluster, namespace, pod, container) (
irate(container_cpu_usage_seconds_total{image!="",job="kubelet",metrics_path="/metrics/cadvisor"}[5m])
) * on(cluster, namespace, pod) group_left(node) topk by(cluster, namespace, pod) (
1, max by(cluster, namespace, pod, node) (kube_pod_info{node!=""})
)
The key metric here is container_cpu_usage_seconds_total. It is a monotonic counter that tracks the total CPU time consumed by a container since it started. By applying irate, we see how fast that value is increasing at any given moment indicating current CPU usage.
CPU Throttling
CPU throttling percentage is calculated by dividing two metrics.
sum(increase(container_cpu_cfs_throttled_periods_total{job="kubelet", metrics_path="/metrics/cadvisor", namespace="$namespace", pod="$pod", container!="", cluster="$cluster"}[$__rate_interval])) by (container)
/
sum(increase(container_cpu_cfs_periods_total{job="kubelet", metrics_path="/metrics/cadvisor", namespace="$namespace", pod="$pod", container!="", cluster="$cluster"}[$__rate_interval])) by (container)
The first is the number of periods that the container has been throttled since it started. The second is the number of periods that the container has used CPU. Dividing the two gives the percentage of throttled periods. This shows how often throttling is happening but it is also possible to get an indication for the severity of the throttling by looking at the throttled seconds:
rate(container_cpu_cfs_throttled_seconds_total{pod="sysbench-cpu", container!=""}[1m])This shows the amount of time the container was throttled per second. If the container has many processes/ threads this number can get very large.
Grafana dashboards are good for an overview, but for this issue they are not granular enough. To get this I looked directly to the container for metrics.
How do metrics get into prometheus?
Prometheus scrapes container metrics from an endpoint served by cAdvisor which is part of kubelet on every node. cAdvisor gets the metrics by reading cGroup files on the containers. Each time Prometheus calls the endpoint it gets a snapshot of the current metrics. You can connect to this endpoint using:
kubectl proxy
curl http://localhost:8001/api/v1/nodes/<node-name>/proxy/metrics/cadvisor
Or you can view the cGroup files directly by execing onto a container like this:
kubectl exec -it pod-name  -- bash
cat /sys/fs/cgroup/cpu.stat
You will see output like this:
usage_usec 7885318
user_usec 7801286
system_usec 84031
nr_periods 97
nr_throttled 74
throttled_usec 15300049
nr_bursts 0
burst_usec 0
Verifying and Solving the Issue
To get more granular data I used the following command inside a container to read this file every 0.1 seconds and output the difference in CPU counter each time, drawing a line relative to the size of the difference.
prev=0; while true; do curr=$(awk '/usage_usec/ {print $2}' /sys/fs/cgroup/cpu.stat); delta=$((curr - prev)); len=$((delta / 3000)); printf "%6d | %s\n" "$delta" "$(printf '#%.0s' $(seq 1 $len))"; prev=$curr; sleep 0.1; done
Immediately I could see what Grafana missed. There was extremely spiky traffic. Confident Alexandru's suggestion was right I removed the CPU limit. The throttling stopped instantly.
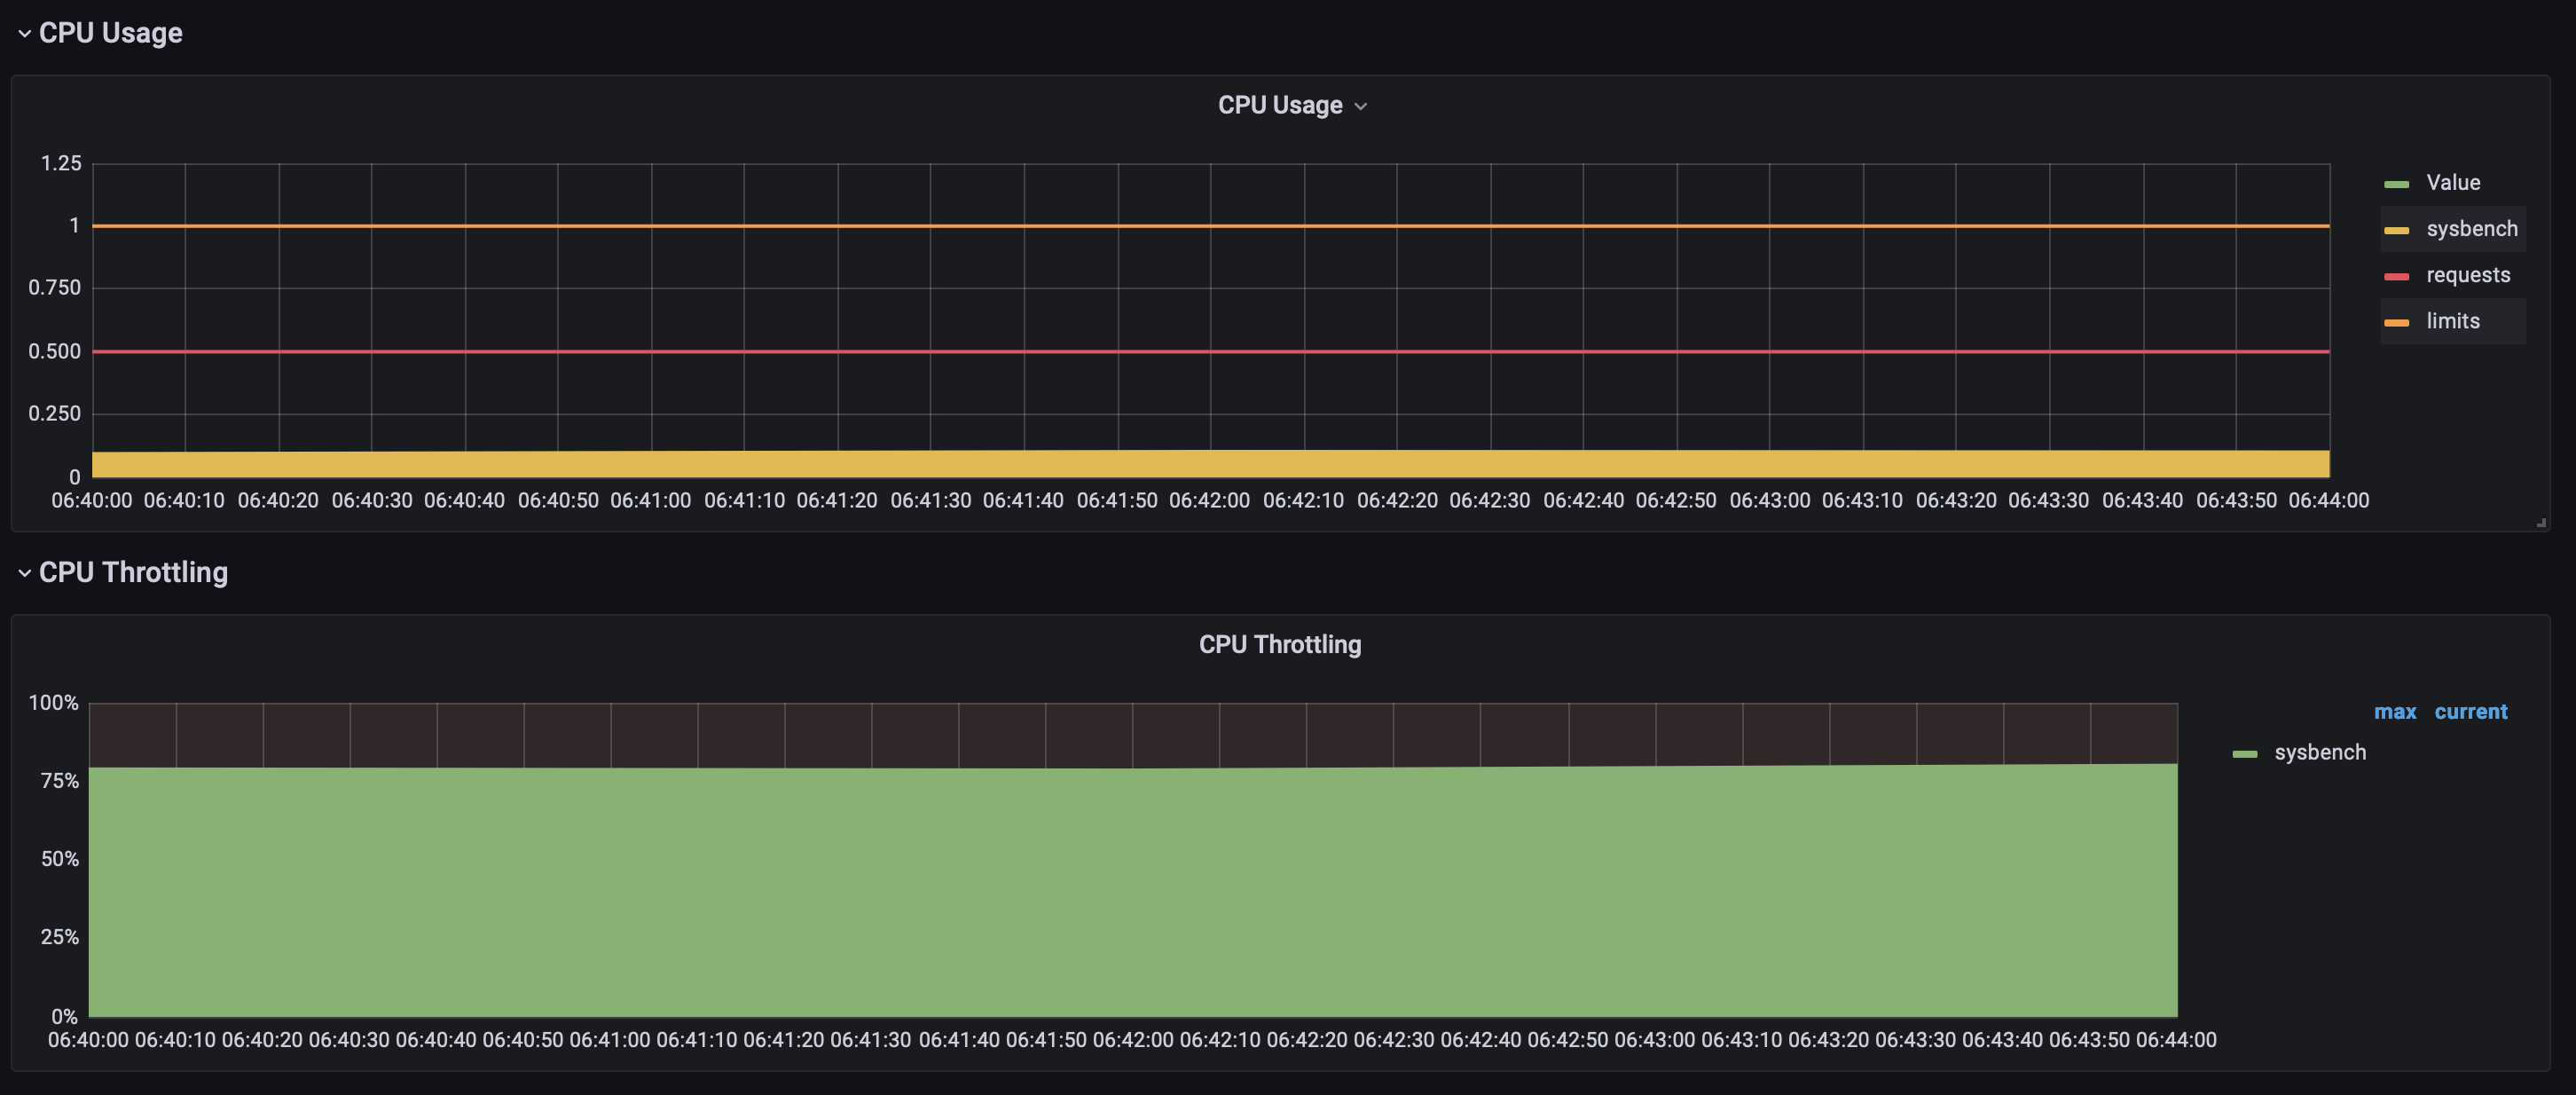
Recreating the issue using sysbench
I recreated the issue locally for this post using Minikube and a sysbench deployment:
apiVersion: v1
kind: Pod
metadata:
  name: sysbench-cpu
spec:
  containers:
  - name: sysbench
    image: severalnines/sysbench
    command:
      - /bin/sh
      - -c
      - |
        while true; do
          echo "Starting CPU burst at $(date)";
          sysbench CPU --threads=4 --time=1 run;
          echo "Sleeping...";
          sleep 3;
        done
    resources:
      requests:
        cpu: "500m"
      limits:
        cpu: "1"
  restartPolicy: Never
Burstable CPU limits
Whilst researching I found Linux CFS now supports burstable CPU limits. This allows containers to ‘save’ their unused quota to use later. This would completely prevent this issue from happening. It looks like we are a way off having this in Kubernetes, but maybe at some point we won’t have to worry so much about the effects of CPU limits.